The SNR strategy
SNR is short for supply and resistance / demand and support — the areas on a chart where price has previously moved away with force, because orders were left unfilled there. Find those areas, wait for price to come back, risk a little to make a lot. Everything below is the actual method we use, drawn out step by step.
Price moves because of unfilled orders
When a large participant wants to buy far more than the market can give them at one price, part of the order gets filled and the rest doesn't. Price runs away. Those unfilled orders sit at that level, waiting. When price eventually comes back, they get triggered — and price tends to move away again. A supply or demand zone is simply the place on the chart where that happened.
Where it happened
Find the base — the tight consolidation price sat in immediately before an aggressive move.
How hard it left
The strength of the departure grades the zone. A slow drift out is a weak zone. A vertical run is a strong one.
Whether it's fresh
Untouched zones are the ones we want. Once price has already returned and filled those orders, the level means far less.
Marking the zone
Draw the rectangle around the base, not around the whole move. Top of the rectangle is the highest body or wick of the consolidation, bottom is the lowest. Then extend it to the right and leave it there.
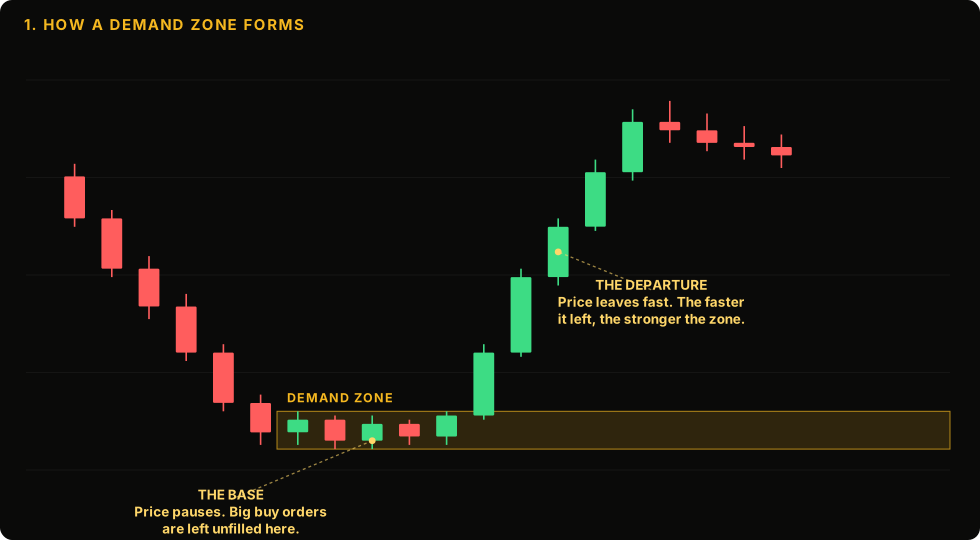
What to look for: a small, tight base followed by a move that leaves it quickly and doesn't look back. The candles that make up the base are your rectangle. The size of the move away is your evidence that something big happened there.
Zone quality checklist
- Tight base — few candles, small range. Sloppy bases make sloppy zones.
- Explosive departure — large-bodied candles leaving the area.
- Structure broken — the move away took out a prior high or low.
- Fresh — price has not returned to it since it formed.
- Higher timeframe agrees — an H4 zone inside a daily uptrend beats one fighting it.
Timeframes we use
- Daily — overall direction. Are we buying dips or selling rallies?
- H4 — where the zones get marked. This is the working timeframe.
- M15 — the trigger. Confirmation and a tighter stop once price is in the zone.
Three timeframes, one direction. If the daily and the H4 disagree, there's no trade — and no trade is a perfectly good outcome.
The entry, the stop, and the maths
This is where most traders lose the plot. The entry is boring. The stop and the ratio are what decide whether the strategy makes money over a hundred trades.
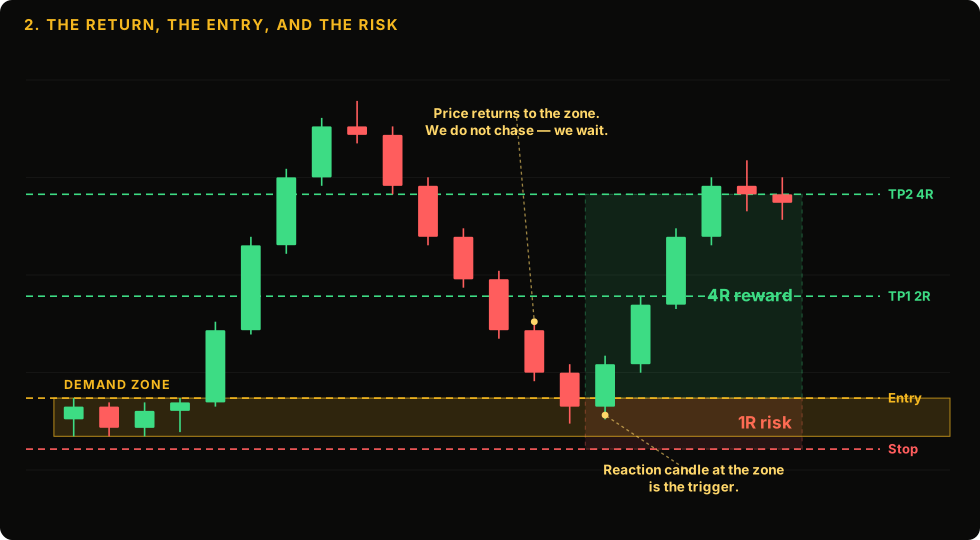
The trade: entry at the top of the zone, stop below the zone low with a small buffer, first target at 2R and second at 4R. Risking one unit to make four means you can be wrong more often than you're right and still finish ahead.
Entry
Two options. A limit order at the zone edge gets the best price and the tightest stop, but takes every touch including the bad ones. Waiting for a confirmation candle on M15 filters out the worst touches, but you give up some of the entry. We mostly wait for confirmation.
Stop loss
Below the zone low on a buy, above the zone high on a sell, plus a small buffer for the spread. The stop marks the point where the idea is objectively wrong — not a round number, not "how much I'm willing to lose". If that stop is too wide for your account, trade smaller or skip it.
Targets
The nearest opposing zone or structural high/low. If that target is less than twice your risk away, the trade isn't worth taking. We take partials at 2R, move the stop to break even, and let the rest run to the next level.
Why 2R minimum matters. At a 3:1 reward-to-risk ratio you only need to be right on 1 trade in 4 to break even. At 1:1 you need to win more than half. The ratio is doing the heavy lifting — not the win rate, and not how confident you feel about the chart.
Selling into supply
Identical logic, flipped. A base at the top of a move that price falls away from is a supply zone — the place sellers left work unfinished.
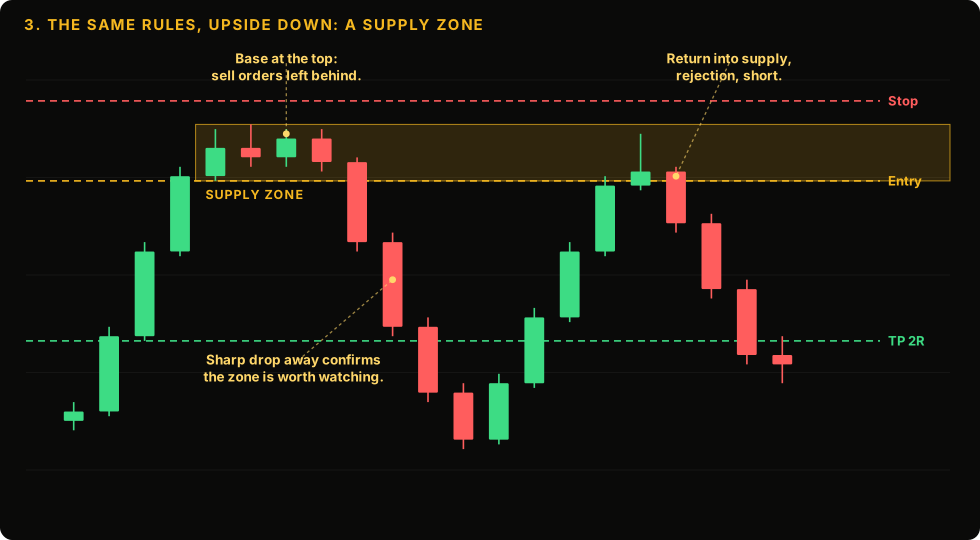
The trade: price rallies back into the supply zone, rejects, and the short triggers with the stop above the zone high. Same checklist, same maths, opposite direction.
Knowing when a zone is finished
The single most common mistake: trading a level over and over because it "worked last time". A zone has a limited amount of unfilled order flow in it. Once that's consumed, the level is just a line on a chart.
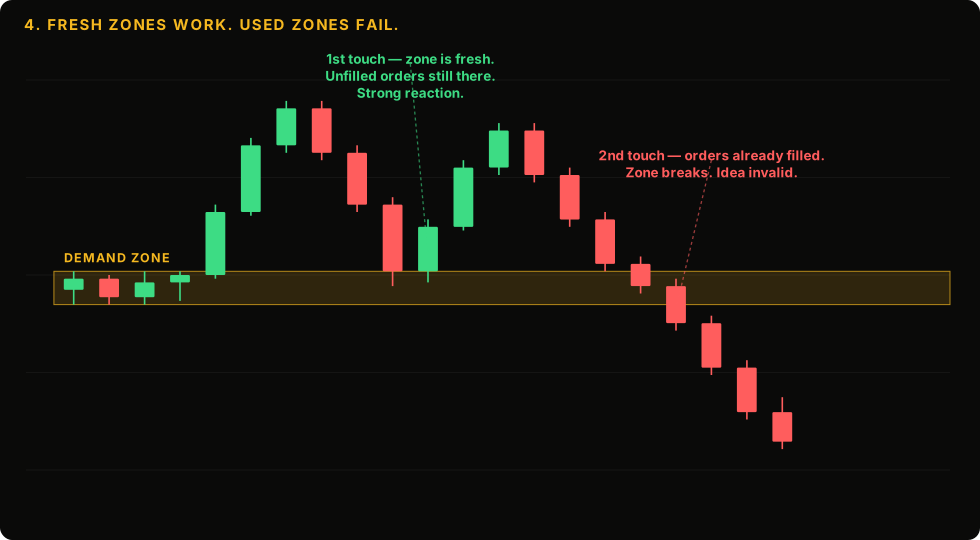
First touch, strong reaction. Second touch, it breaks. We take the first return to a fresh zone. After that the zone comes off the chart — and if price closes through it, the level often becomes resistance on the way back up.
What invalidates the idea
- A candle closes beyond the zone on the working timeframe.
- Price has already returned once since the zone formed.
- The higher timeframe flips direction while you're waiting.
- Price grinds slowly into the zone instead of arriving with momentum.
What we skip entirely
- Zones with less than 2R of clear space to the target.
- Setups directly into high-impact news — spreads widen and stops get taken.
- Anything requiring us to chase after price has left the zone.
- A setup taken because we're bored or trying to win money back.
Risk management is the strategy
You can be handed perfect zones and still blow an account. These rules matter more than any level we'll ever mark.
Per trade
Fixed percentage of account equity, every single trade, no exceptions for the ones that "look really good".
Daily cap
Three losses and the platform closes for the day. This rule alone saves more accounts than any entry model.
Minimum ratio
If the target isn't at least twice the distance of the stop, the setup doesn't qualify. No negotiation.
Revenge trades
The trade taken immediately after a loss, without a setup, is the most expensive habit in retail trading.
Reality check. This strategy loses. Regularly. Any strategy that claims otherwise is being sold to you rather than traded. A run of five losers in a row is a normal statistical outcome, not a sign the method is broken — which is exactly why the position sizing rules above exist. Trading carries a real risk of losing your capital, and most people who try it lose money.
Learn it properly. For free.
The full breakdown — zone marking practice, entry models, sizing, journalling — is inside the community, alongside daily charts marked up using exactly this method.